Most developer experience surveys fail for one simple reason: they tell you that something is wrong, but not where the system is breaking or what to fix first.
This is where a well-designed DevEx pulse survey becomes powerful. It doesn’t just measure sentiment — it reveals where time is lost, where work slows down, and where the system needs to improve.
In our DevEx AI tool, we use two sets of survey questions:
DevEx Pulse (one question per area to track overall delivery performance) and DevEx Deep Dive (focused diagnostics when something needs attention).
DevEx Pulse presented here shows where friction is. DevEx Deep Dive explains why it exists.
Below are 35 DevEx Pulse questions you can use to measure developer experience across the full delivery flow — from planning to production. They help you identify where problems start and what’s slowing teams down.
If you want to move faster, our DevEx AI tool tool automates this analysis — turning survey results and comments into clear insights, priorities, and recommended actions.
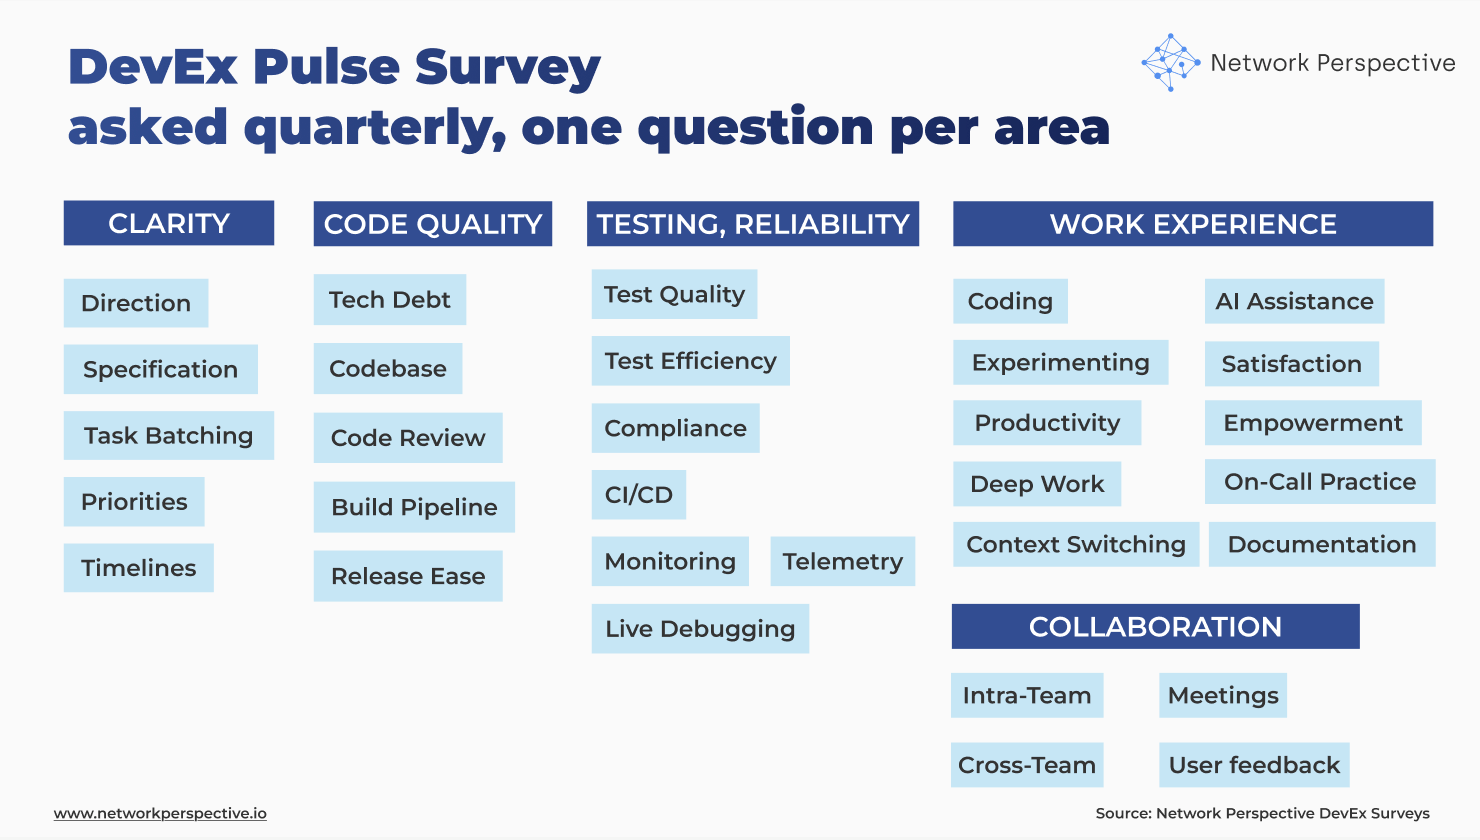
The DevEx pulse survey is structured around three core parts of the system:
Each section is paired with a critical question: How much time is lost here every week?
This is what changes everything.
Instead of asking: “Is this good or bad?” we ask: “How many hours does this cost us every week?”
That shift turns DevEx from opinion → measurable system cost.
Read The Developer Experience Research Project that examines factors that shape how engineers work, collaborate, and deliver value. Grounded in hundreds of interviews with engineering leaders, it distills this breadth of evidence into five key dimensions of developer experience that drive technical excellence and business outcomes.
If this section shows friction, use DevEx Deep Dive questions to understand what’s causing it and where the system breaks. Learn more about survey questions and case studies.
If this section shows friction, use DevEx Deep Dive questions to understand what’s causing it and where the system breaks. Learn more about DevEx Deep Dive survey questions and DevEx case studies.
If this section shows friction, use DevEx Deep Dive questions to understand what’s causing it and where the system breaks. Learn more about DevEx Deep Dive survey questions and DevEx case studies.
If this section shows friction, use DevEx Deep Dive questions to understand what’s causing it and where the system breaks. Learn more about DevEx Deep Dive survey questions and DevEx case studies.
If this section shows friction, use DevEx Deep Dive questions to understand what’s causing it and where the system breaks. Learn more about DevEx Deep Dive survey questions and DevEx case studies.
Are we starting work in a good place — or figuring things out too late?
This section tests whether teams understand:
Direction ↓, Specification ↓
→ Teams don’t understand what to build.
Specification ↓, Task batching ↓
→ Work is unclear and too big → hard to start.
Priorities ↓, Timelines ↓
→ Planning is unstable or unrealistic.
All high, Effort ↑
→ Looks good on paper, but hidden rework exists.
Key insight: If work isn’t clear at the start, everything downstream gets slower.
Does the system help changes move forward — or slow them down?
This section looks at:
Codebase ↓, Tech debt ↓
→ Code is hard to work with.
Code review ↓, Build pipeline ↓
→ Delivery flow is blocked.
Release ease ↓ only
→ Final step is the bottleneck.
All medium/high, Effort ↑
→ Hidden friction in everyday work.
Key insight: Even small friction in code or pipeline compounds across every change.
Do we catch problems early — or deal with them later?
This section covers:
Test quality ↓, Test efficiency ↓
→ Tests don’t help or slow things down.
CI/CD ↓, Monitoring ↓
→ Weak feedback loops.
Live debugging ↓
→ Problems are hard to fix in production.
Cross-team impact ↓
→ Surprises from other teams.
All decent, Effort ↑
→ System works, but costs too much time.
Key insight: Reliability is about early signal + fast recovery — not just tests.
Each section includes a simple question: How many hours per week do you lose here?
This is the most important part of the survey. It allows you to:
Without effort, you get opinions. With effort, you get a map of where engineering time is lost.
Quantitative scores show where the problem is. Comments show why. Look for:
Key insight: Comments are not feedback — they are evidence of how the system behaves in reality.
This is exactly where our DevEx AI tool becomes essential. Manually reading hundreds of comments, clustering themes, and connecting them to system issues is slow and subjective.
Our DevEx AI tool does this automatically:
Instead of spending days interpreting results, teams get:
clear diagnosis → prioritized problems → actionable guidance
This is the difference between collecting feedback and running a DevEx system.
This is where insights become decisions.
Planning & Clarity ↓ + Effort ↑
Interpretation: Work starts before it’s ready → rework downstream.
Code Quality ↓ + Testing ↓ + Effort ↑
Interpretation: System slows down changes (reviews, CI/CD, releases).
Testing & Reliability ↓ + Effort ↑
Interpretation: Issues found too late → firefighting.
All scores medium/high + Effort ↑
Interpretation: Hidden friction not visible in satisfaction scores.
Planning ↑ + Code Quality ↓ / Testing ↓
Interpretation: Good intent, weak delivery system.
AI has made one part of the system dramatically faster: writing code. But DevEx data and DORA data shows a consistent pattern: AI didn’t reduce engineering work — it moved the bottlenecks.
Teams can now: generate code faster, explore more options and produce more output. But the rest of the system hasn’t caught up. What may happen next?
When coding speeds up:
The result? Local optimization ≠ system improvement You get: faster coding, slower delivery, more rework
and higher cognitive load.
The hidden cost? Comprehension Debt. This is the new form of technical debt. VPs of Engineering need to manage comprehension debt. It shows up as: more time spent reading and verifying code, lower trust in changes, slower reviews, and more reliance on “who knows this”. And it’s often invisible — until you look at Effort.
AI makes writing code faster, but unless the system improves, it just shifts the bottleneck to review, testing, and understanding.
This is exactly why the survey measures:
Because AI doesn’t remove work — it shifts it downstream.
Key insight: If you optimize coding without improving the system around it, you don’t go faster — you just move the pain.
This is where insight is as contradictions show where the system appears healthy but fails in practice. These are your strongest signals.
High satisfaction, high Effort
→ People adapted to a broken system.
Planning ↑, Effort ↑
→ Work looks clear but isn’t actionable.
Codebase ↑, Release ease ↓
→ Dev OK, delivery system broken.
Tests ↑, Bugs still happen (via comments)
→ False confidence.
Cross-team impact ↓, everything else ↑
→ External dependencies are the real problem.
Key insight: Contradictions show where the system looks healthy but fails in practice.
A common mistake is treating AI as a separate topic. It’s not. Good AI assistance in coding, or good agent experience is just good developer experience. If:
AI doesn’t fix a broken system — it amplifies it.
That’s why AI questions in DevEx surveys are not about tools. They are about:
Improving DevEx improves AI effectiveness automatically.
What NOT to say
What TO say (use this framing)
Show only three things:
A good DevEx survey doesn’t measure happiness.
It shows:
And when combined with AI-powered interpretation, it becomes something much more powerful:
A system that continuously finds and removes friction from how teams build software.
