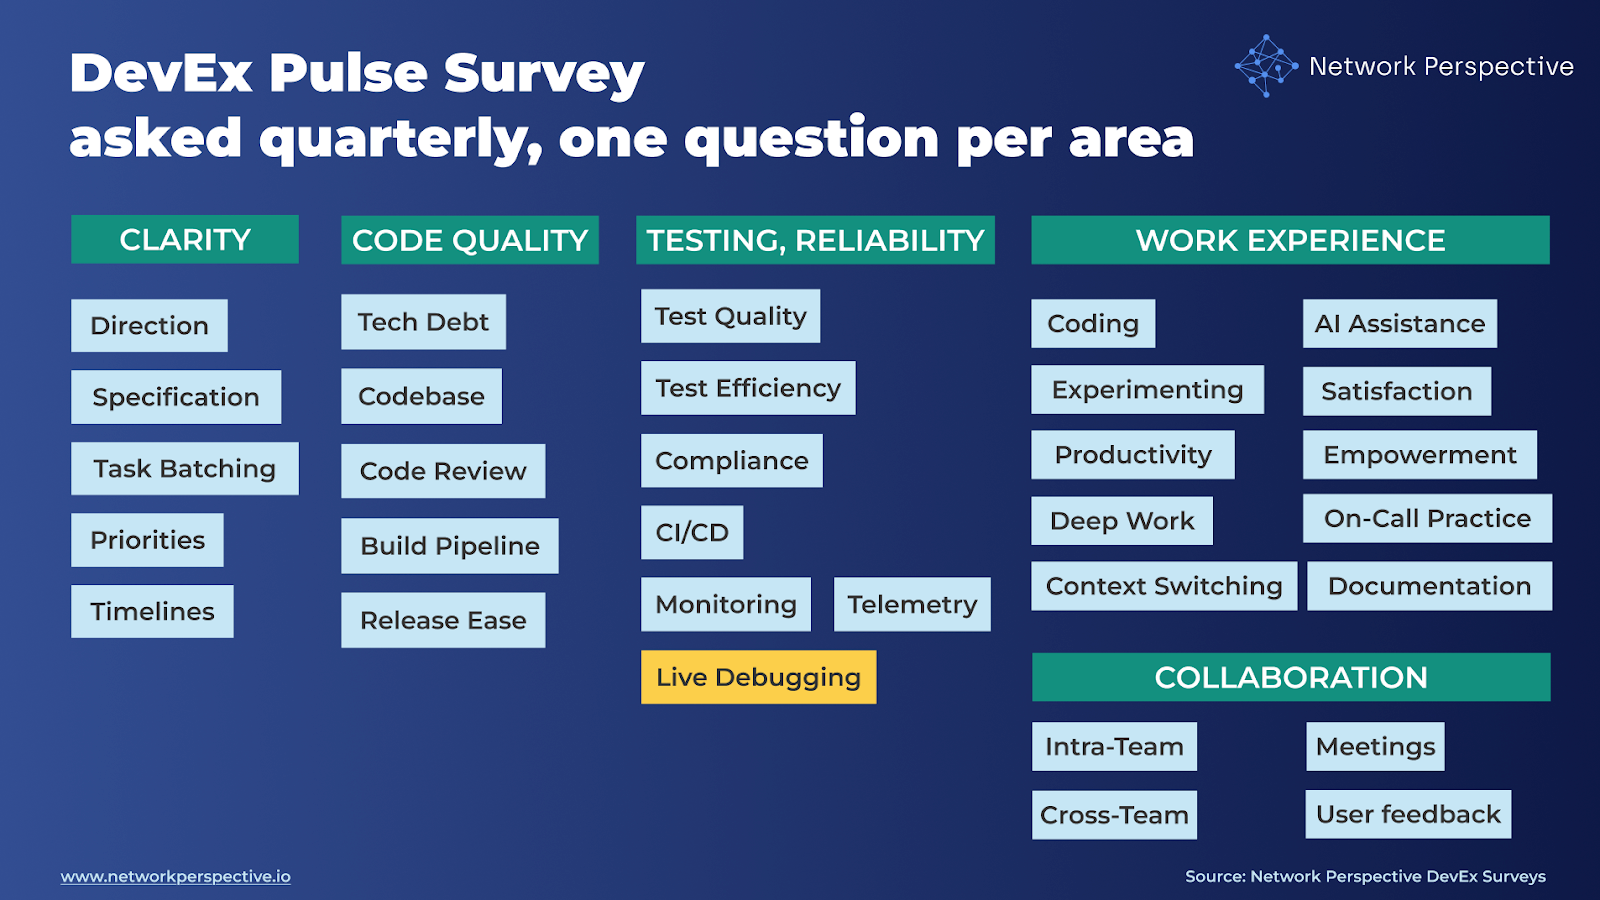
In our DevEx AI tool, we use two sets of survey questions: DevEx Pulse (one question per area to track overall delivery performance) and DevEx Deep Dive (a focused root-cause diagnostic when something needs attention).
DevEx Pulse tells us where friction is. DevEx Deep Dive tells us why it exists.
Let’s take a closer look at Live debugging. If the Pulse question “Our tools make production debugging easy.” receives low scores and developers’ comments reveal significant friction and blockers, what should you do next?
Here are 10 deep dive questions you can ask your developers to uncover the causes of friction in live debugging, along with guidance on how to interpret the results, common patterns engineering teams encounter, and practical first steps for improvement. This will help you pinpoint what’s causing the problem and fix it on your own, or move faster with our DevEx AI tool and expert guidance.
The real question is: When something breaks in production, can teams quickly see what’s happening and fix it safely?
Deep dive questions should help you map how live debugging flows through your delivery process and identify where it breaks down:
Visibility → Access → Context → Safety → Resolution → Ownership → Cost
Here’s how the DevEx AI tool helps uncover this.
Can teams see what’s happening in prod?
Can teams move quickly?
Is there enough context to understand issues?
Can teams debug without fear?
Do tools help fix the issue?
Are live debugging tools looked after?
Weekly / Thinking about debugging production issues, searching for missing data, setting up workarounds, or relying on others for help — about how much time is spent in a typical week dealing with this?
Ideas to spot or reduce friction?
When something breaks in production, can teams quickly see what’s happening and fix it safely — or do they struggle to get answers and take action? Here’s how the DevEx AI tool helps make sense of the results.
Questions
What this section tests
Whether teams can see what’s happening in production when a problem occurs.
How to read scores
Key insight
You can’t debug what you can’t see.
Open-ended comments – how to read responses
Key insight
Missing visibility turns incidents into guesswork.
Questions
What this section tests
How fast teams can begin debugging once an issue appears.
How to read scores
Key insight
Slow starts increase stress and extend outages.
Open-ended comments – how to read responses
Key insight
Time lost at the start is rarely recovered later.
Questions
What this section tests
Whether teams can connect the dots during live debugging.
How to read scores
Key insight
Debugging is faster when signals tell a single story.
Open-ended comments – how to read responses
Key insight
Missing context multiplies investigation time.
Questions
What this section tests
Whether teams can debug without fear of making things worse.
How to read scores
Key insight
Fear slows action more than lack of tools.
Open-ended comments – how to read responses
Key insight
Safe tools enable faster fixes.
Questions
What this section tests
Whether live debugging leads to fixes, not just observation.
How to read scores
Key insight
Seeing the problem isn’t enough — teams need help fixing it.
Open-ended comments – how to read responses
Key insight
Good debugging shortens time to fix, not just time to see.
Questions
What this section tests
Whether live debugging tools are actively maintained, not left to decay.
How to read scores
Key insight
Debugging tools get worse over time without ownership.
Open-ended comments – how to read responses
Key insight
Incident pain repeats when tools don’t improve.
Question
How to read responses
Key insight
Time spent firefighting is the real cost of poor live debugging.
Pattern:
Visibility ↓ + Context ↓
Interpretation
Teams lack the data needed to understand issues in prod.
Pattern:
Speed ↓ + Effort ↑
Interpretation
Too much time is lost before debugging even begins.
Pattern:
Safety ↓ + Action ↓
Interpretation
Teams hesitate to act, extending outages.
Pattern:
Care ↓ + Repeated comments
Interpretation
Live debugging tools aren’t improving after incidents.
Live view ↑, Clear cause ↓
→ Data is visible, but not helpful.
Fast start ↑, Low risk ↓
→ Teams can act quickly, but feel unsafe.
Linked data ↑, User path ↓
→ System view exists, but user impact is unclear.
Owned ↑, Improved ↓
→ Responsibility exists without follow-through.
Contradictions show where tools exist but don’t work together.
What NOT to say
What TO say (use this framing)
“This shows where our live debugging tools help or slow down incident response.”
“The issue isn’t effort — it’s visibility, safety, and clarity.”
Show three things only:
Here’s how the DevEx AI tool will guide you toward making first actions.
You can’t debug what you can’t see.
If Live view ↓, Right data ↓
First steps:
Small rule:
No incident ends without adding one missing signal.
Time lost at the start is rarely recovered.
If Fast start ↓, No setup ↓
First steps:
Small rule:
Anyone on-call can start investigating within 5 minutes.
Signals must tell one story.
If Linked data ↓, User path ↓
First steps:
Small rule:
Every production request can be traced end-to-end.
Fear slows action more than missing tools.
If Low risk ↓, Guardrails ↓
First steps:
Small rule:
Debugging in prod should never require heroics.
Seeing is not fixing.
If Clear cause ↓, Next step ↓
First steps:
Small rule:
Every alert must point to the next action.
Tools decay without ownership.
If Owned ↓, Improved ↓
First steps:
Small rule:
Live debugging is someone’s job — not everyone’s job.
First step:
Visibility ↓ + Context ↓
First steps:
Goal:
See reality before reacting to it.
Speed ↓ + Effort ↑
First steps:
Goal:
Reduce time-to-first-insight.
Safety ↓ + Action ↓
First steps:
Goal:
Replace fear with guardrails.
Care ↓ + repeated comments
First steps:
Goal:
Stop tool decay.
Live view ↑, Clear cause ↓
Data visible, but useless
First step:
Fast start ↑, Low risk ↓
Can act fast, but feel unsafe
First step:
Linked data ↑, User path ↓
System view exists, but user story missing
First step:
Owned ↑, Improved ↓
Ownership without progress
First step:
Every debugging improvement must do at least one of these:
If it does none of those → it’s cosmetic.
Run one structured incident review focused only on “What made debugging hard?”
Not:
But:
Then fix just one of those.
Repeat monthly.
That alone shifts:
Without a transformation program.
What you’ve seen here is only a small part of what the DevEx AI platform can do to improve delivery speed, quality, and ease.
If your organization struggles with fragmented metrics, unclear signals across teams, or the frustrating feeling of seeing problems without knowing what to fix, DevEx AI may be exactly what you need. Many engineering organizations operate with disconnected dashboards, conflicting interpretations of performance, and weak feedback loops — which leads to effort spent in the wrong places while real bottlenecks remain untouched.
DevEx AI brings these scattered signals into one coherent view of delivery. It focuses on the inputs that shape performance — how teams work, where friction accumulates, and what slows or accelerates progress — and translates them into clear priorities for action. You gain comparable insights across teams and tech stacks, root-cause visibility grounded in real developer experience, and guidance on where improvement efforts will have the highest impact.
At its core, DevEx AI combines targeted developer surveys with behavioral data to expose hidden friction in the delivery process. AI transforms developers’ free-text comments — often a goldmine of operational truth — into structured insights: recurring problems, root causes, and concrete actions tailored to your environment.
The platform detects patterns across teams, benchmarks results internally and against comparable organizations, and provides context-aware recommendations rather than generic best practices.
Progress on these input factors is tracked over time, enabling teams to verify that changes in ways of working are actually taking hold, while leaders maintain visibility without micromanagement. Expert guidance supports interpretation, prioritization, and the translation of insights into measurable improvements.
To understand whether these changes truly improve delivery outcomes, DevEx AI also measures DORA metrics — Deployment Frequency, Lead Time for Changes, Change Failure Rate, and Mean Time to Recovery — derived directly from repository and delivery data. These output indicators show how software performs in production and whether improvements to developer experience translate into faster, safer releases.
By combining input metrics (how work happens) with output metrics (what results are achieved), the platform creates a closed feedback loop that connects actions to outcomes, helping organizations learn what actually drives better delivery and where further improvement is needed.
